Maps
Justification
Maps will allow you to represent data spatially - i.e. you can plot the data at the point that you collected it on a map. This technique is useful when your data was collected across an area using random or stratified sampling. To do this you need to have a very good base map to start with.
Example 1 - Base Map of Worcester

Example 2 - Isoline Map

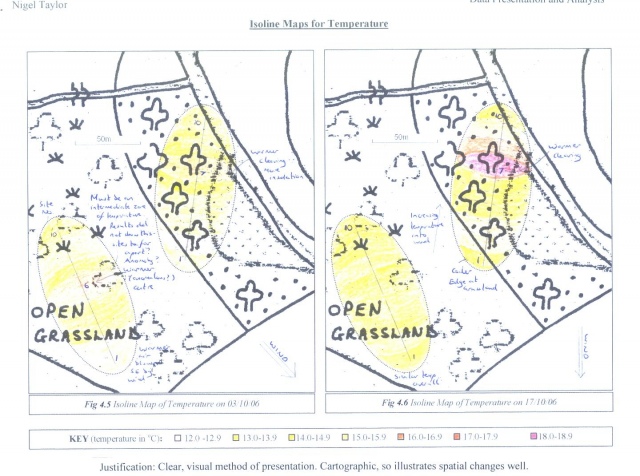
Example 3 - Located Isoline Maps
|